2017 Workplace Experiences Survey Results
More than 6,000 faculty and staff participated in the UBC Workplace Experiences Survey in November 2017.
- Together with our survey partner, TalentMap, Human Resources presented the survey results at open sessions in Vancouver and the Okanagan. The overall results are available below.
- All eligible units (those with 10 or more survey respondents) received their unit-level reports.
- Units were encouraged to connect with their Human Resources Advisor before making requests for additional data cuts. Additional data cuts can be helpful in further understanding specific themes. For example, you may wish to see if experiences related to professional growth may differ in your unit according to a demographic such as length of service. Learn more about working with your results here.
UBC Overall Results
The overall result for faculty and staff are available here (PDF).
The report, as presented at the WES Results Open Sessions, includes:
- About the Workplace Experiences Survey
- Engagement & Survey Approach
- Workplace Experiences Survey Trends
- Overall Results Highlights
- Faculty Engagement – Key Drivers
- Staff Engagement – Key Drivers
- Next Steps – Your Role
Highlights

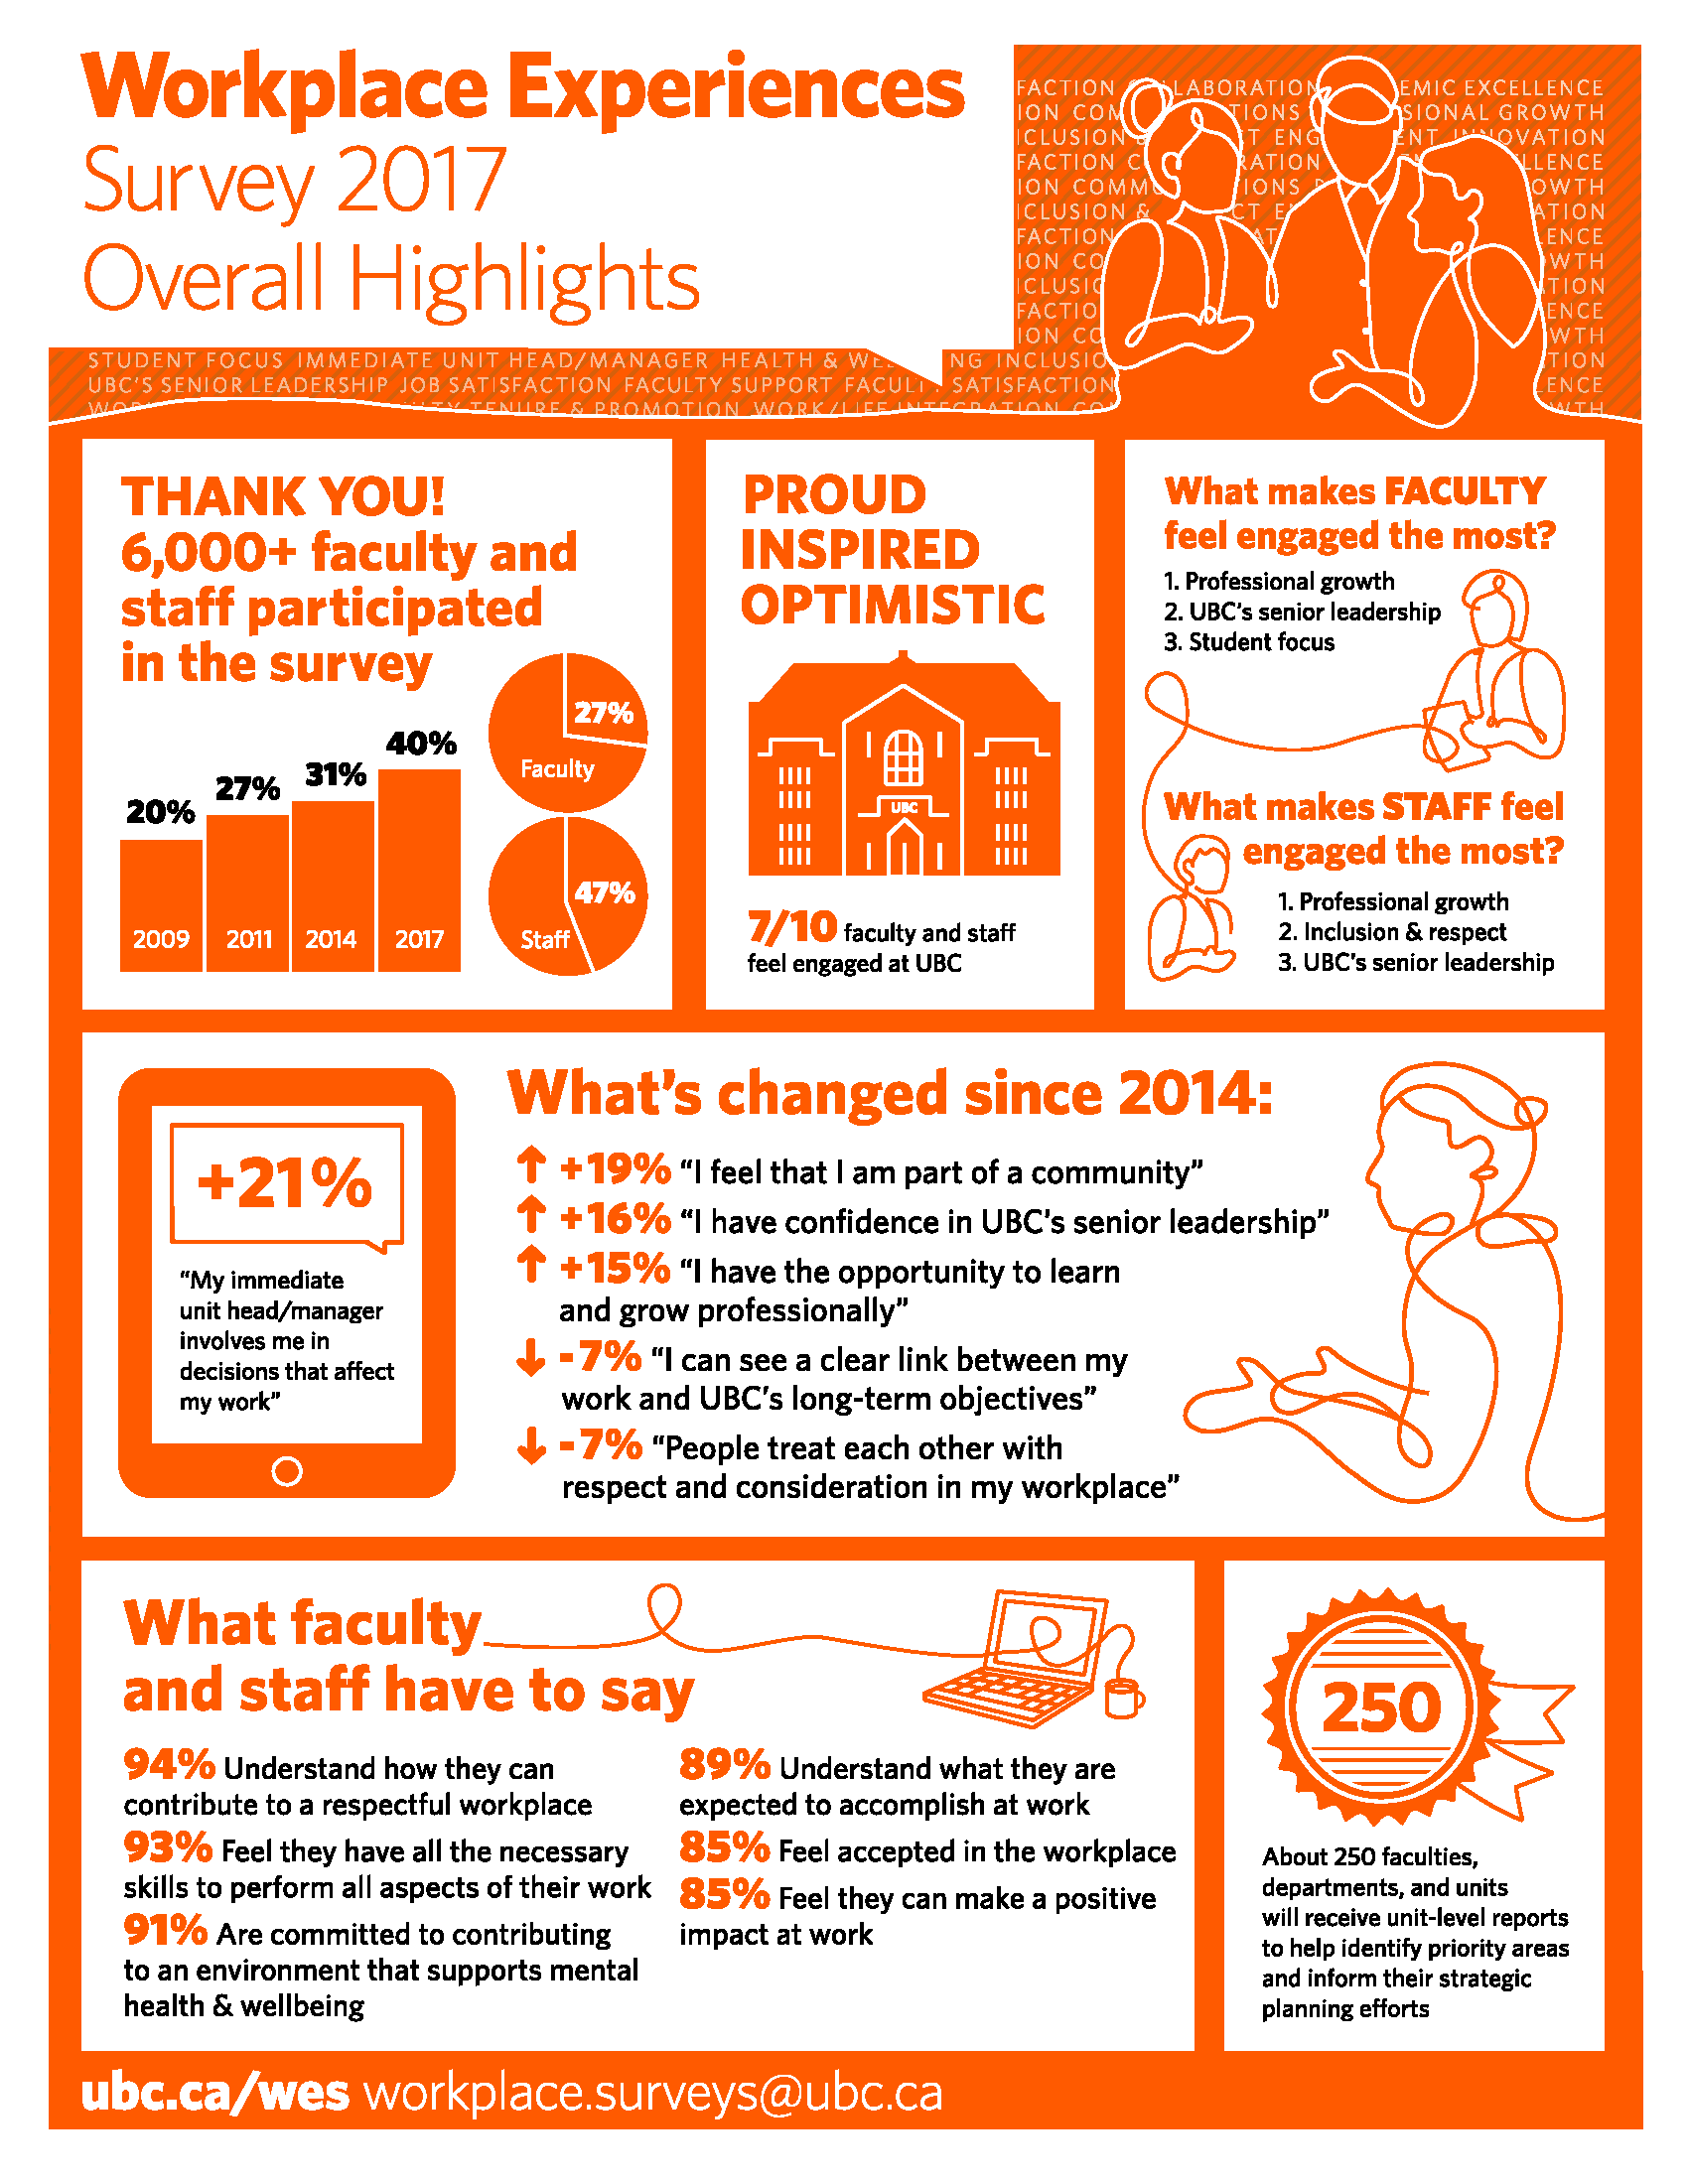
Download the overall WES highlights as a one-page infographic (PDF).
- Over 6,000 faculty and staff participated – a 9% increase since the previous survey!
- 7/10 faculty and staff feel proud, inspired and optimistic
- 94% of faculty and staff say they understand how they can contribute to a respectful workplace
- 93% of faculty and staff feel they have all necessary skills to perform all aspects of their work
- 85% of faculty and staff feel they can make a positive impact at work
- Since 2014:
- 21% more respondents report that their immediate unit head/manager involves them in decision that affect their work
- 19% more respondents feel that they are part of a community
- 16% more respondents have confidence in UBC’s senior leadership
- 15% more respondents have the opportunity to learn and grow professionally
- Key drivers of faculty engagement are professional growth, UBC’s senior leadership and student focus.
- Key drives of staff engagement are professional growth, inclusion & respect, and UBC’s senior leadership.
Survey Surprises
As we continue to share and reflect on the results of the survey, we have found some interesting and surprising findings!
Assumption
Faculty are less likely to participate in the Workplace Experience Surveys therefore the results are not representative of their experiences.
Finding
Overall response rates were 47% for staff and 27% for faculty. Further analysis revealed that 46% of tenure-stream faculty participated in the WES; this is on-par with the staff response rate.
Assumption
The WES results are broad and therefore not relevant to specific experiences within a specific unit.
Finding
About 250 faculties, departments, and units received unit-level reports to help identify priority areas and inform their strategic planning efforts; every Faculty and mid-sized unit in Vancouver received a report. Units with less than 10 responses were bundled into the next appropriate report. 14 units across UBC had response rates of 80% or higher.
